Features
Everything you need to govern AI agents
Full visibility, zero trust runtime, audit-ready by design — governance without code changes. Every feature below is real and available in the free tier.
Pillar 1 · Full visibility
See what your agents actually do
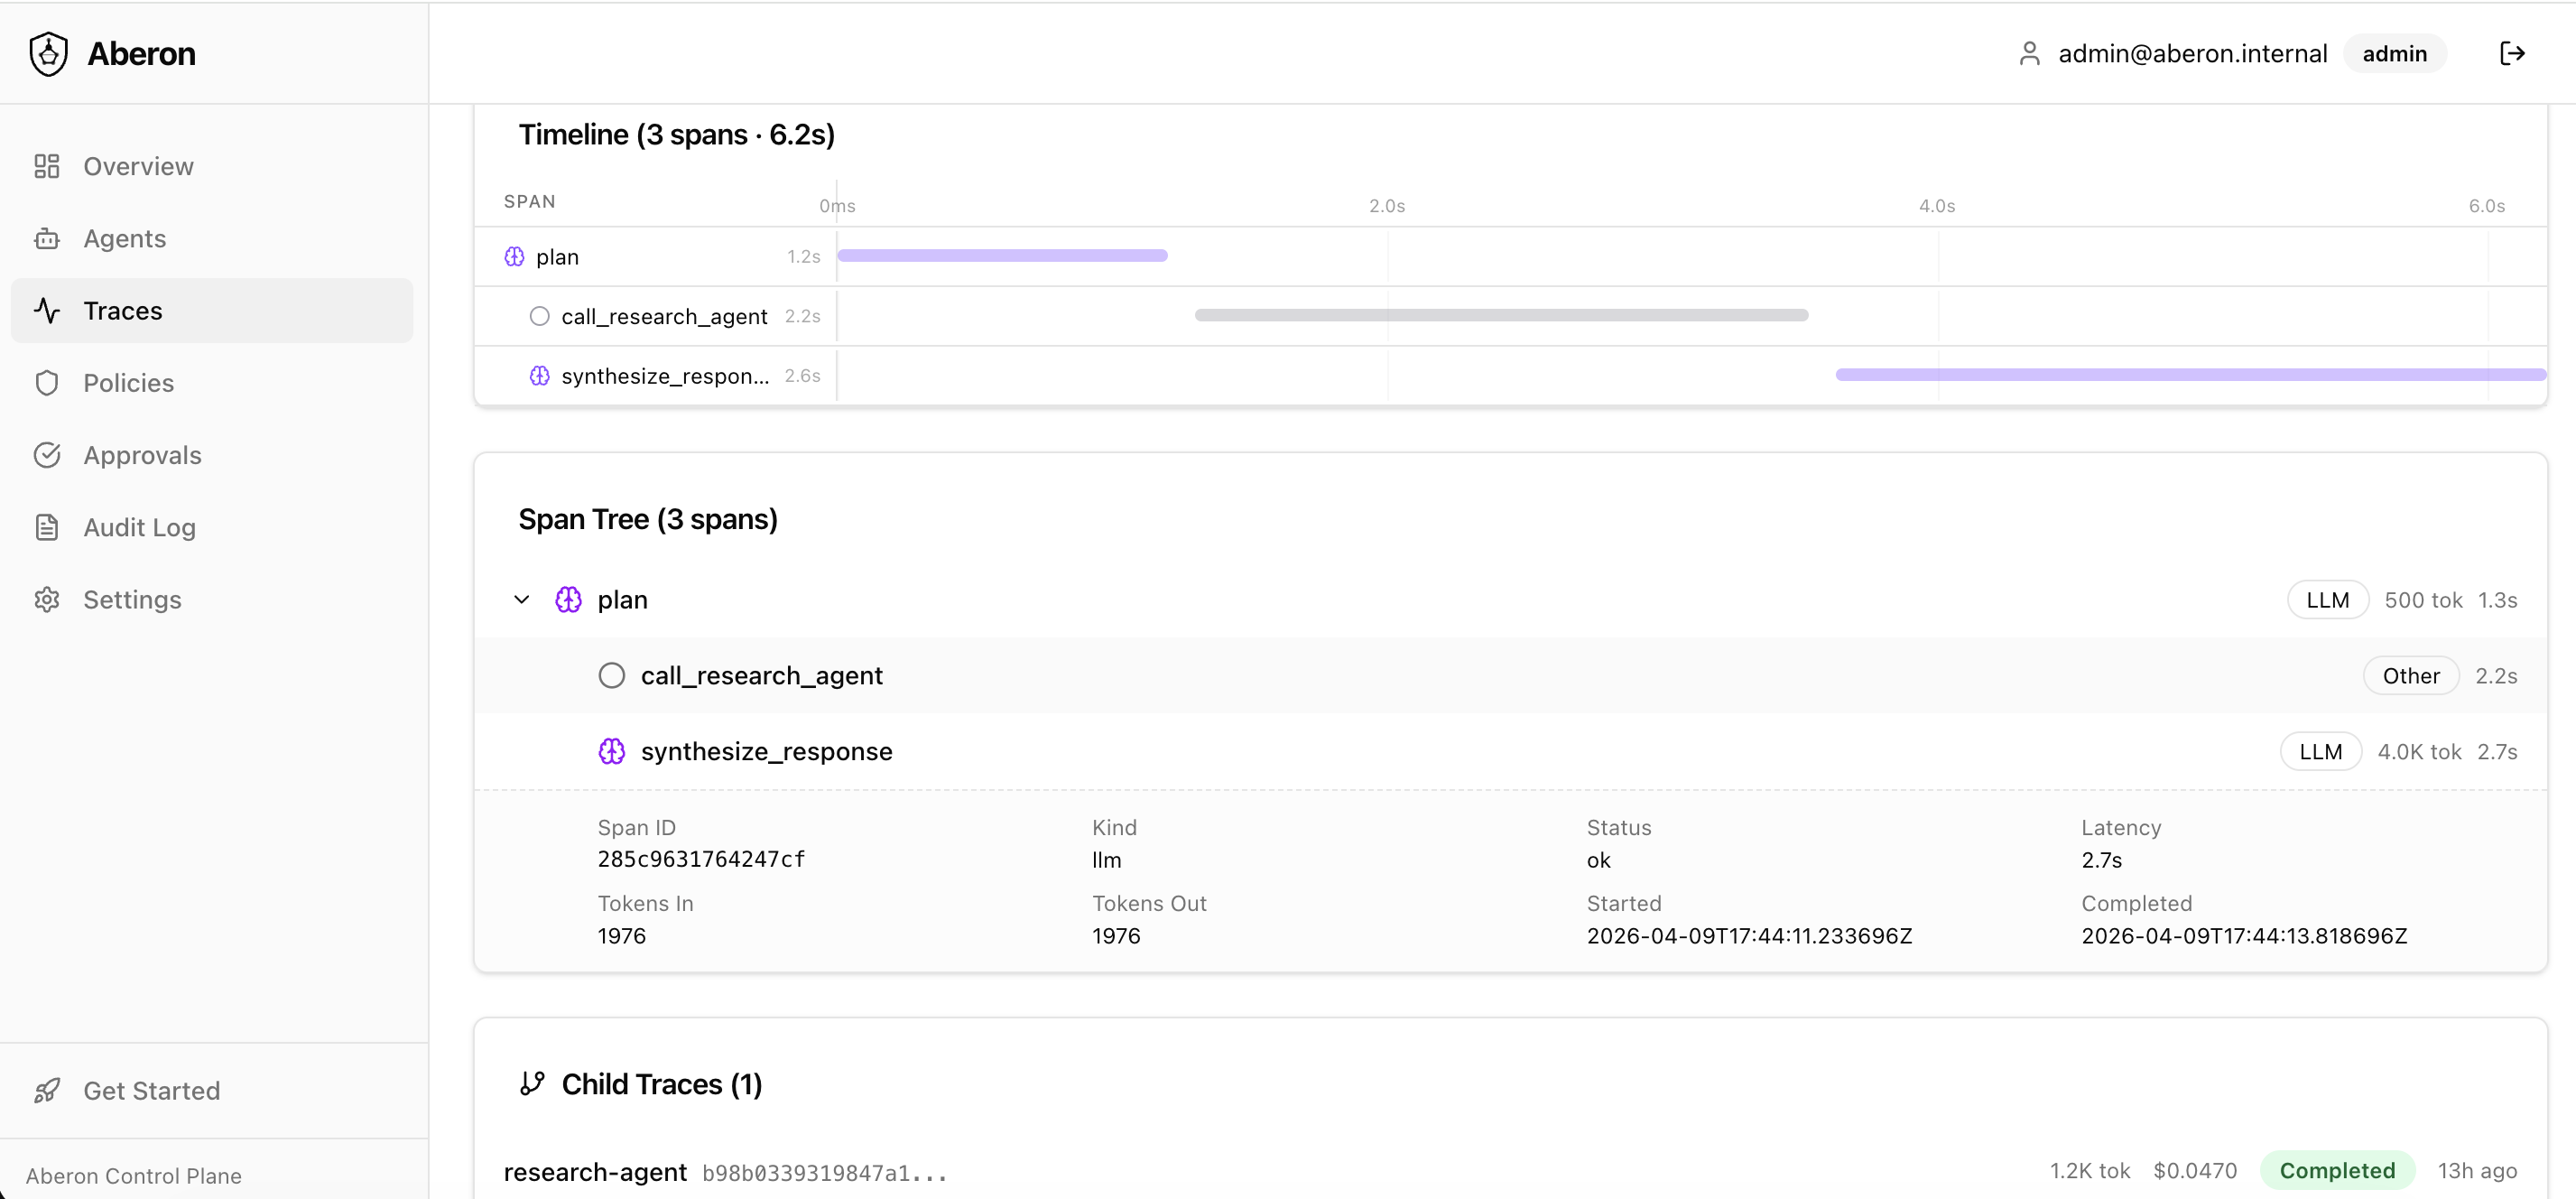
Real-time trace tree: every LLM call, tool invocation, and sub-agent handoff — with cost, latency, and token count per span. Waterfall timeline surfaces bottlenecks in seconds.
Proof: trace a 5-agent pipeline from input to output on one screen.
Scenario
Multi-agent pipeline visibility
Problem
Orchestrator calls Research Agent and Summarizer. Each works independently. Where's the bottleneck? How much does each step cost?
Solution
Aberon links all spans via parent_trace_id.
One page shows the entire chain: orchestrator → research → summarizer,
with cost, latency, and token count per span.
- ✓ Waterfall timeline across agents
- ✓ Click any span for full details
- ✓ Bottleneck identification
Scenario
Live agent monitoring
Problem
At 3 AM one of 5 agents starts returning errors. By morning, 200+ tickets have no response.
Solution
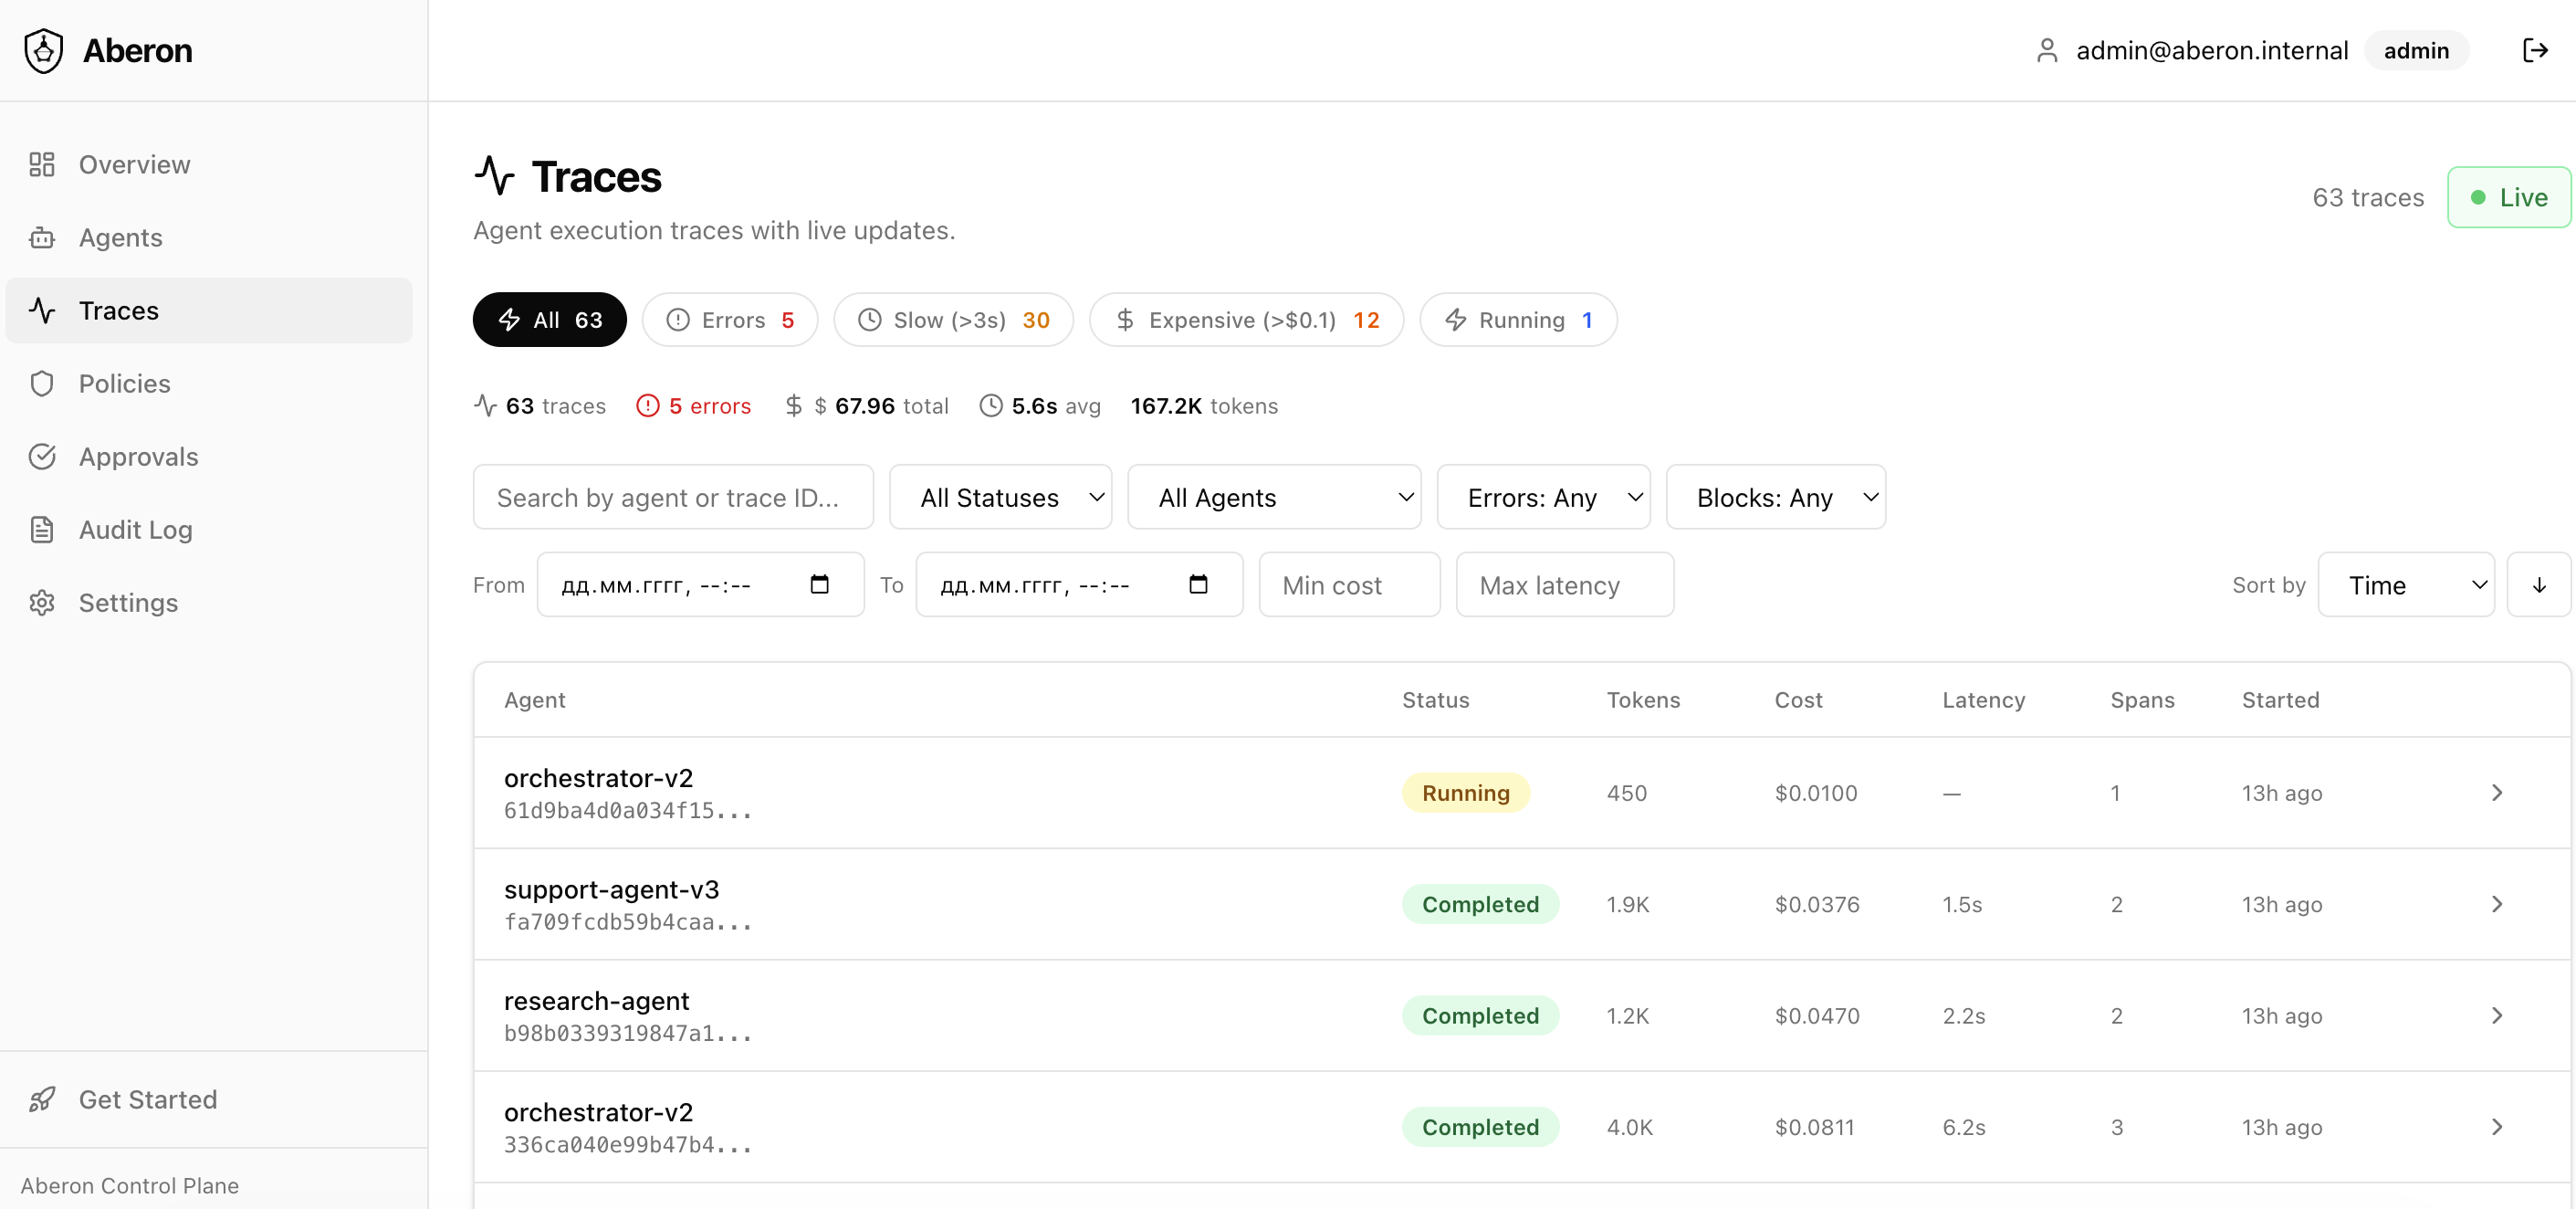
Real-time SSE dashboard. Quick filters for errors, slow traces, expensive runs. Drill down to the exact span and error message. Problems visible in seconds, not hours.
- ✓ Real-time SSE streaming
- ✓ Quick filters: Errors, Slow, Expensive
- ✓ Drill-down to exact error span
Scenario
5-minute integration
Problem
Your team already built an agent on LangChain. Adding observability means rewriting code, configuring Datadog, setting up dashboards…
Solution
3 lines of Python. No code changes to your agent. Cost, latency, errors visible in seconds.
- ✓ Works with LangChain, AutoGen, LlamaIndex, custom
- ✓ Cost, latency, errors — visible immediately
- ✓ Zero changes to your existing agent code
Pillar 2 · Zero trust runtime
Stop problems before they happen
Pre-action enforcement: PII redacted by Presidio before storage, dangerous tools blocked in real time, cost limits with human-in-the-loop gates — no changes to your agent code.
Proof: execute_sql blocked; spend over $50 → paused for approval.
Scenario
Block dangerous tool calls
Problem
Support agent has access to search_kb,
create_ticket,
send_email,
execute_sql.
The last two are dangerous — the agent could hallucinate and send an email
or run SQL against production.
Solution
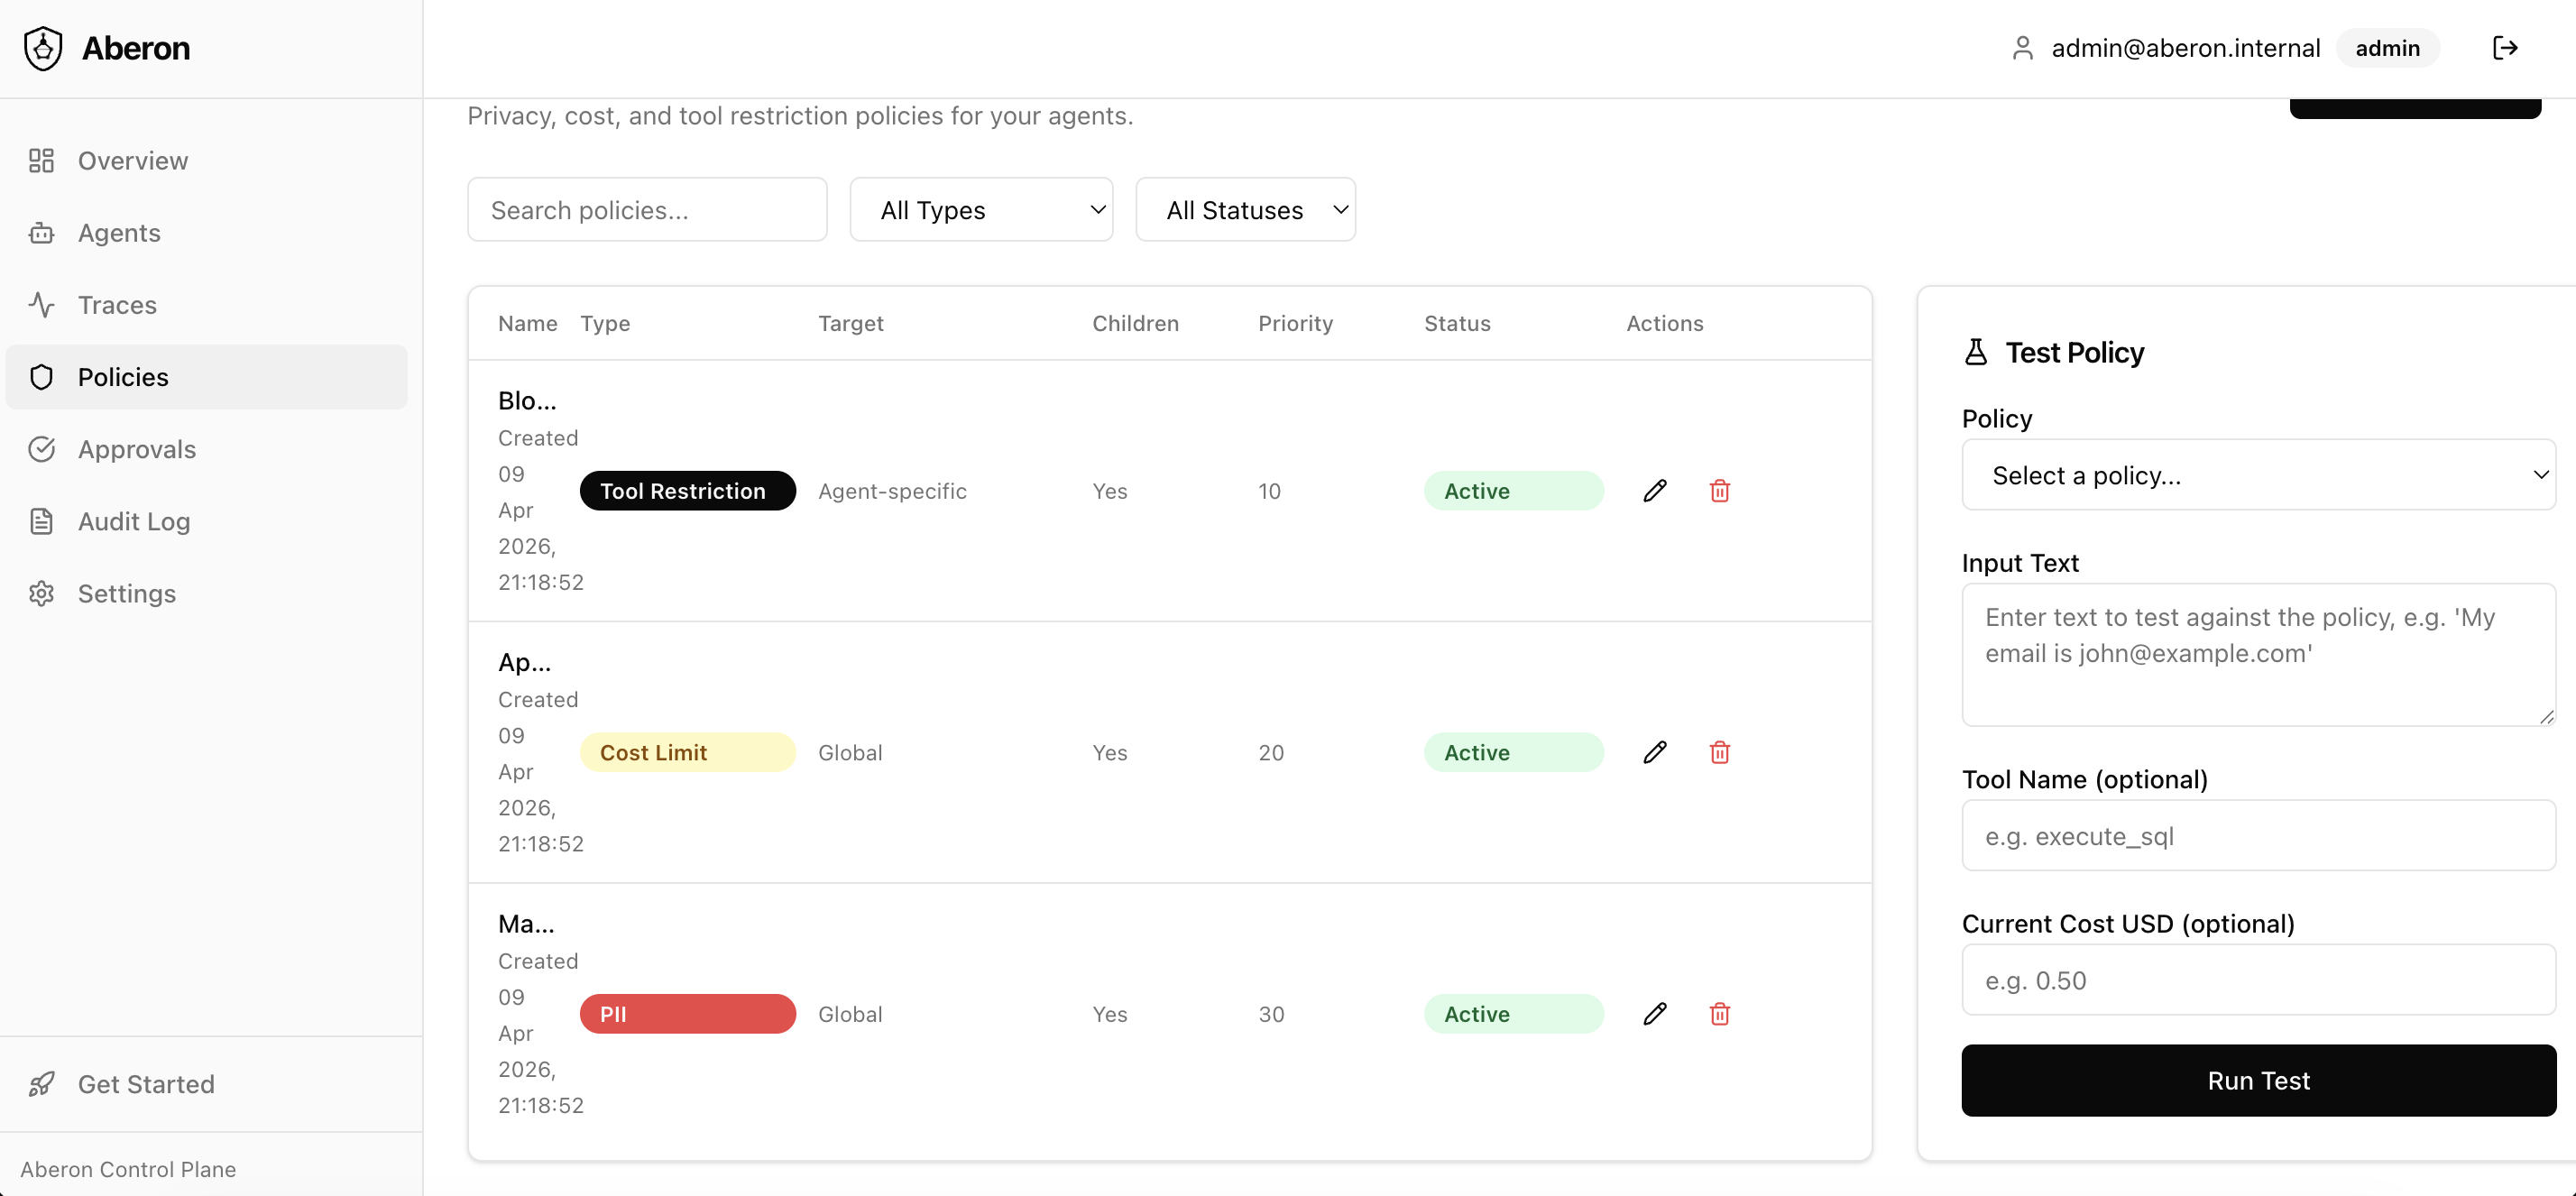
One policy: block execute_sql and
send_email.
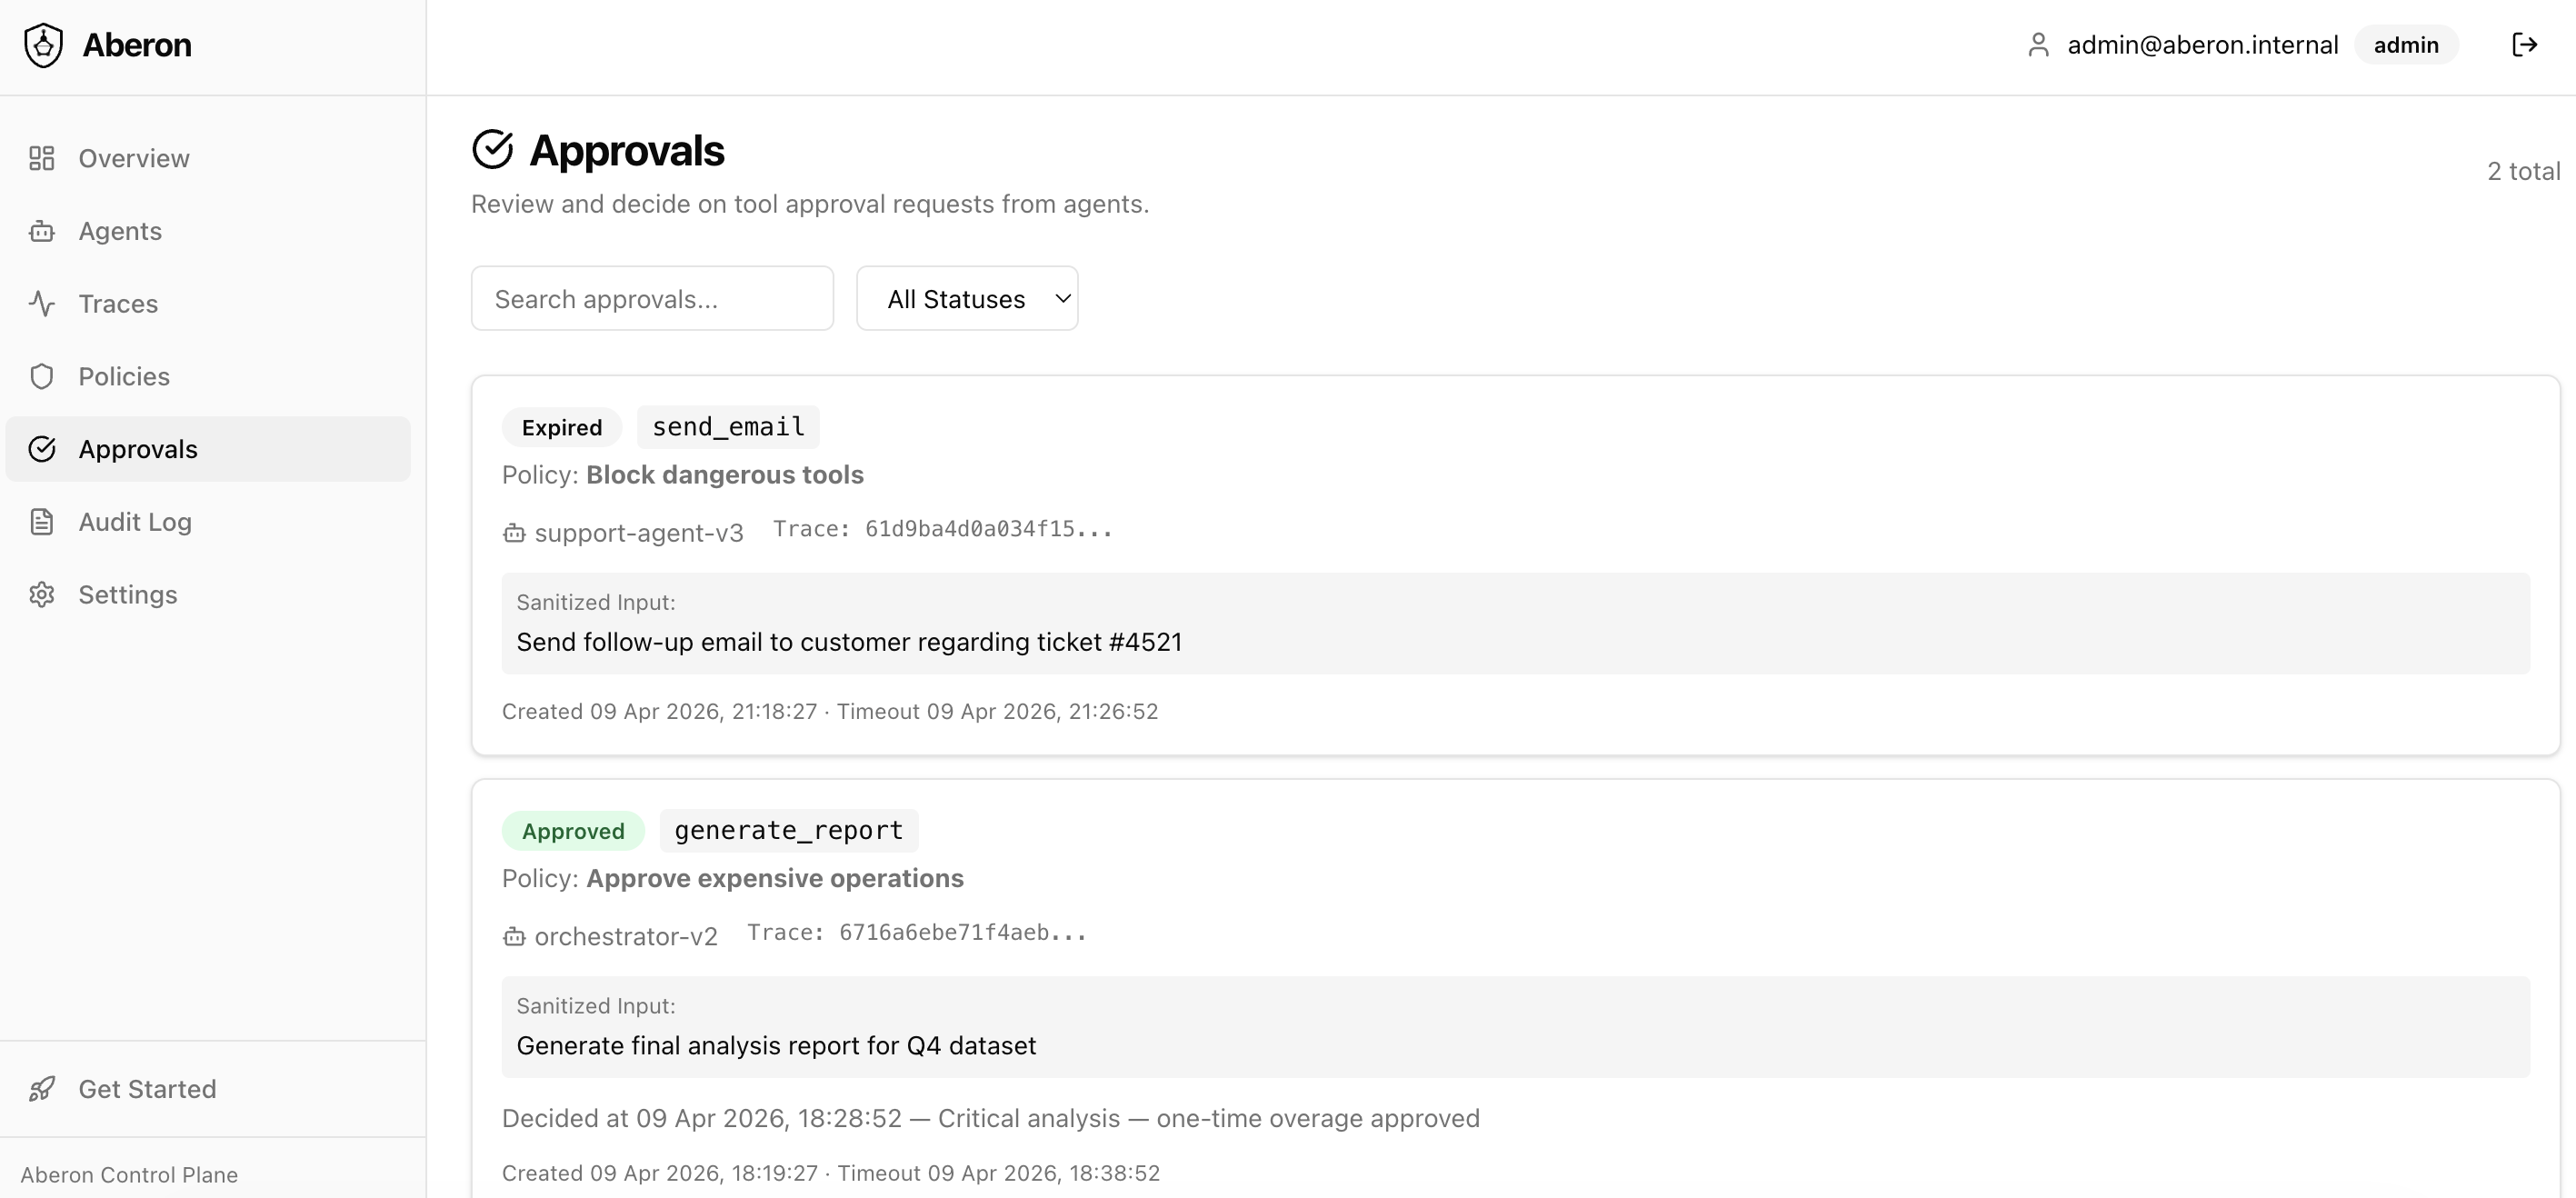
Agent cannot call them. Every attempt is logged in audit trail.
Setup takes 2 minutes, no code changes.
Scenario
Cost control with human approval
Problem
Data Analysis Agent processes large datasets through GPT-4. Normal request costs $0.50. But sometimes the agent enters a loop and racks up hundreds of dollars.
Solution
Cost limit policy: if trace exceeds $50, agent pauses and requires human approval. Analyst sees full context, approves or rejects. Every decision recorded in audit trail.
Scenario
Automatic PII masking in traces
Problem
HR Agent works with salaries, SSNs, bank accounts. Compliance requires: PII must not be stored in logs or observability tools.
Solution
PII detection policy with Presidio. Automatically detects and masks PERSON, PHONE, CREDIT_CARD, SSN, IBAN in all traces. Raw data never reaches storage.
- ✓ GDPR/HIPAA compliance out of the box
- ✓ PII detected automatically (Presidio)
- ✓ Raw data never stored
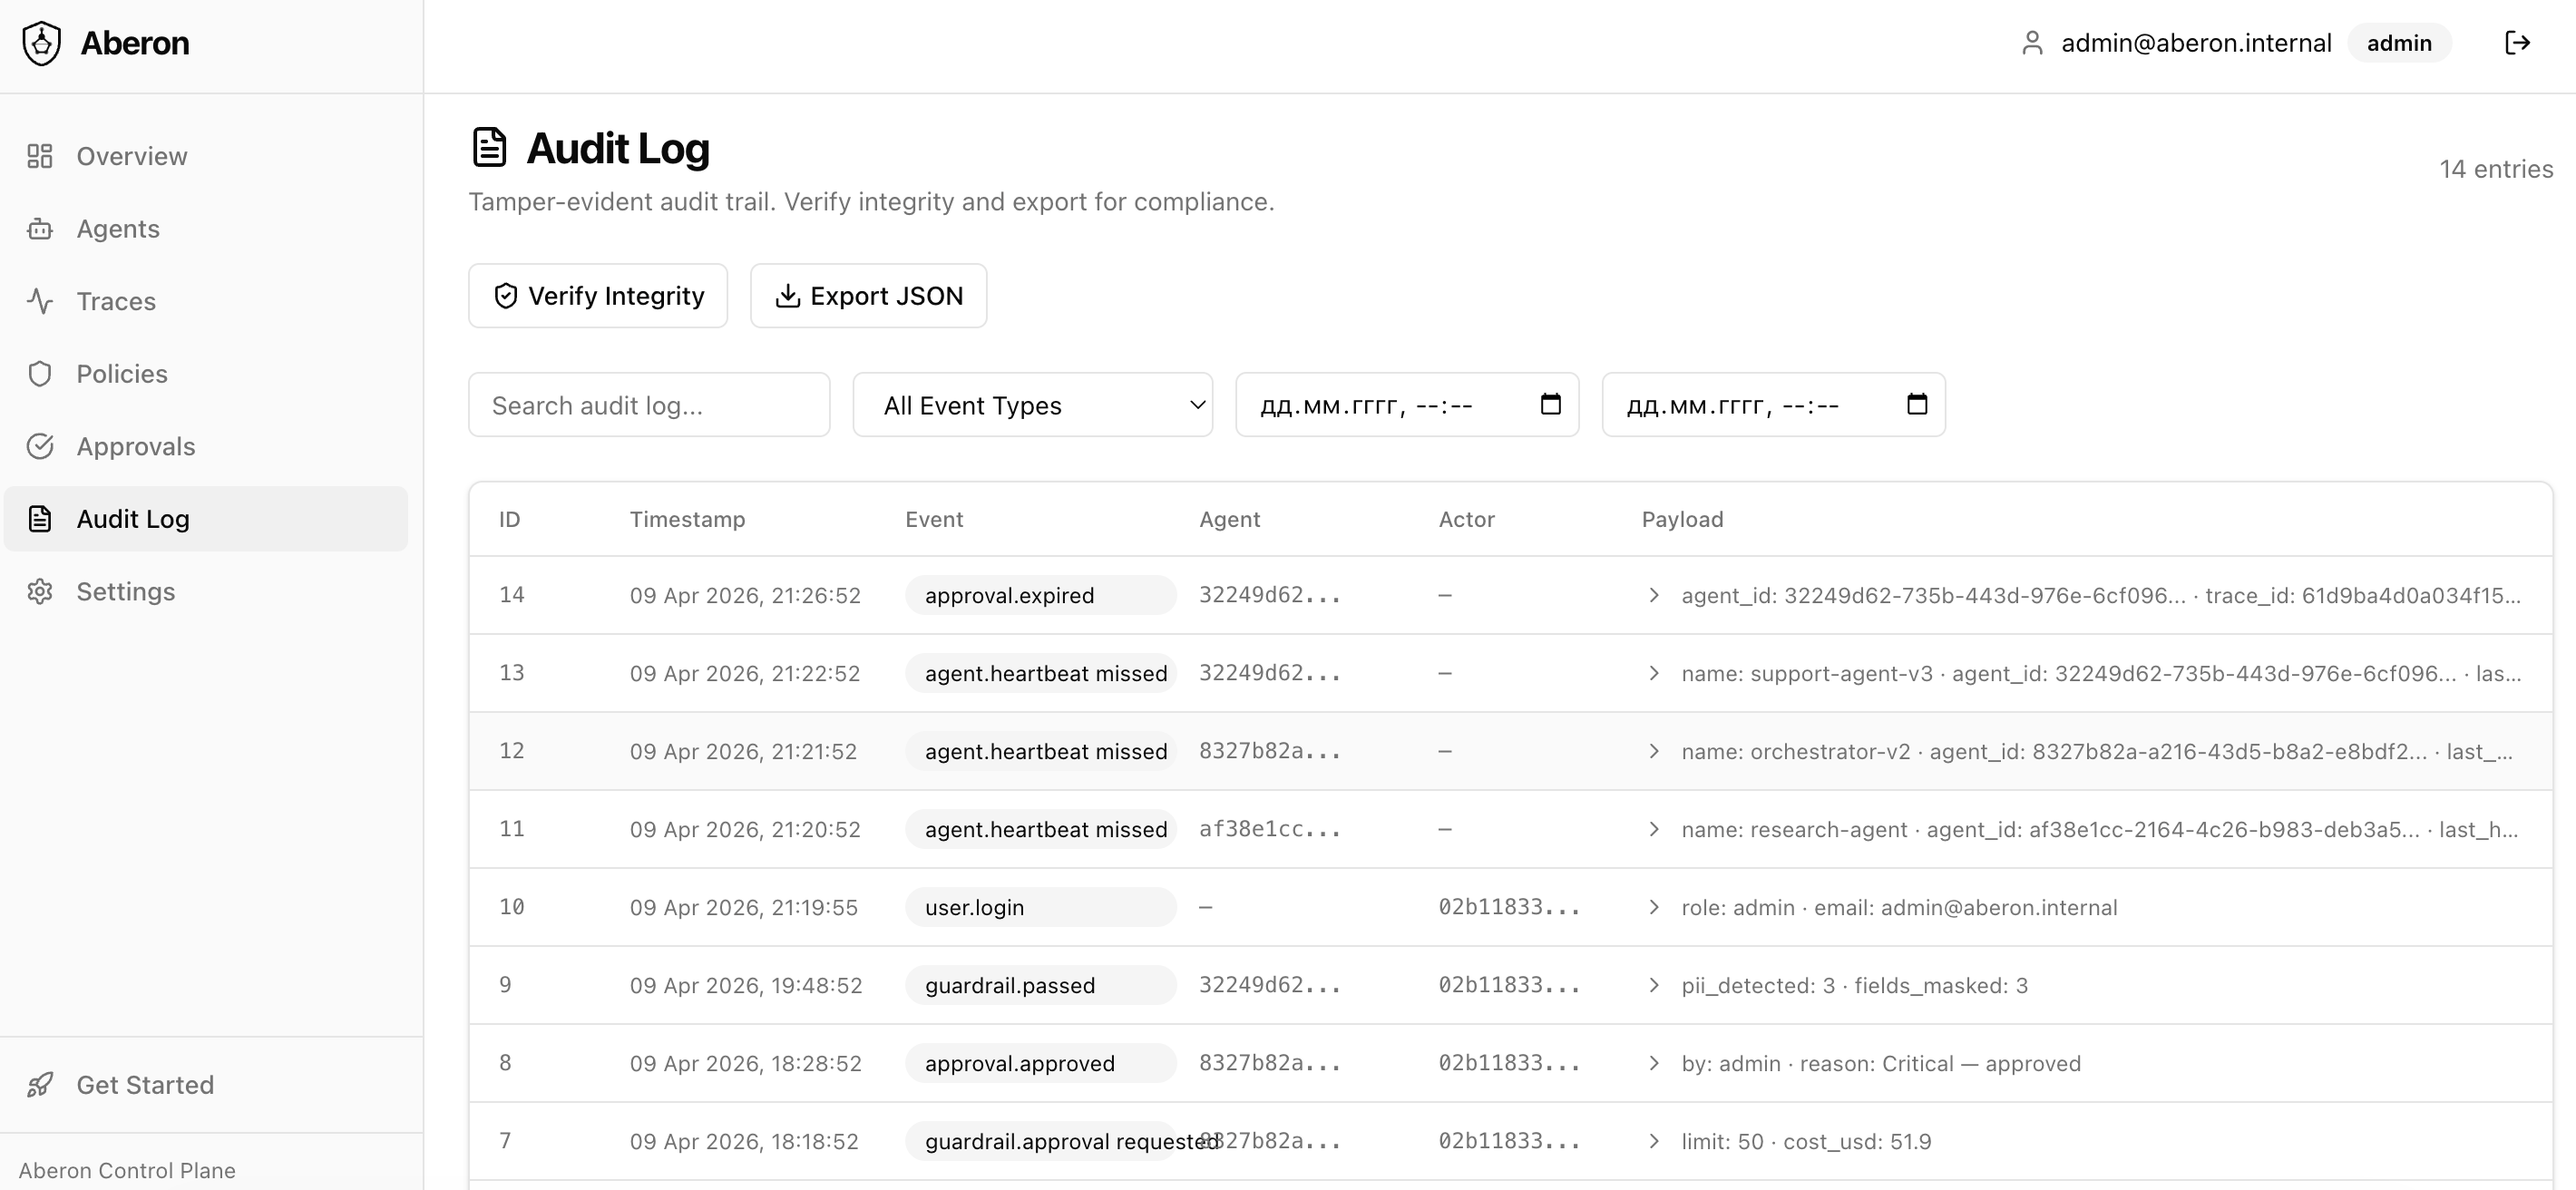
Pillar 3 · Audit-ready
Prove everything to anyone
Tamper-evident SHA-256 hash chain: who did what, when, who approved — one-click verify, JSON export for compliance. Even your admins can’t alter past entries without breaking the chain.
Proof: verify the entire audit chain in one click; export for any compliance framework.
Scenario
Immutable audit trail for regulators
Problem
A bank uses AI for credit decisions. The regulator asks: which decisions did AI make, who approved them, and prove the logs haven't been modified.
Solution
Every audit entry includes a SHA-256 hash of itself plus the previous entry's hash. Modify any record and all subsequent hashes break. One-click verification.
- ✓ Hash chain — tamper-evident
- ✓ Verify Integrity — one click
- ✓ Export JSON for external audit
Scenario
Multi-agent visibility with data isolation
Problem
An orchestrator coordinates 3 agents: Research, Writing, Review. The orchestrator sees full context (including PII), but child agents must not have access to each other's data.
Solution
Each agent gets its own capture_mode:
orchestrator records everything, child agents record redacted or metadata-only.
PII is masked at the agent level. The auditor sees data is protected
without accessing the details.
- ✓ Full pipeline visibility with data isolation
- ✓ PII stays in orchestrator — child agents see masks
- ✓ Auditor verifies compliance without seeing raw data
Scenario
Hybrid: cloud orchestrator, local agents on raw data
Problem
You want a strong frontier model to plan routes, retries, and the global workflow — but regulated or sensitive payloads cannot live in cloud logs or SSE streams. On-prem you only have smaller models, yet those hosts are trusted to see full documents and prompts.
Solution
Run the orchestrator in the cloud with capture_mode: redacted
or metadata_only so dashboards and traces there show structure,
timing, costs, and outcomes — not raw prompts or PII. Run worker agents on-premises with
capture_mode: full inside your VPC so Aberon records complete
context where data is already allowed. Same product, two trust zones, one coherent trace tree.
- ✓ Strong model steers the pipeline; sensitive text stays off cloud traces
- ✓ Local agents see full inputs/outputs where policy allows
- ✓ One waterfall: global picture in the cloud, deep detail on-prem
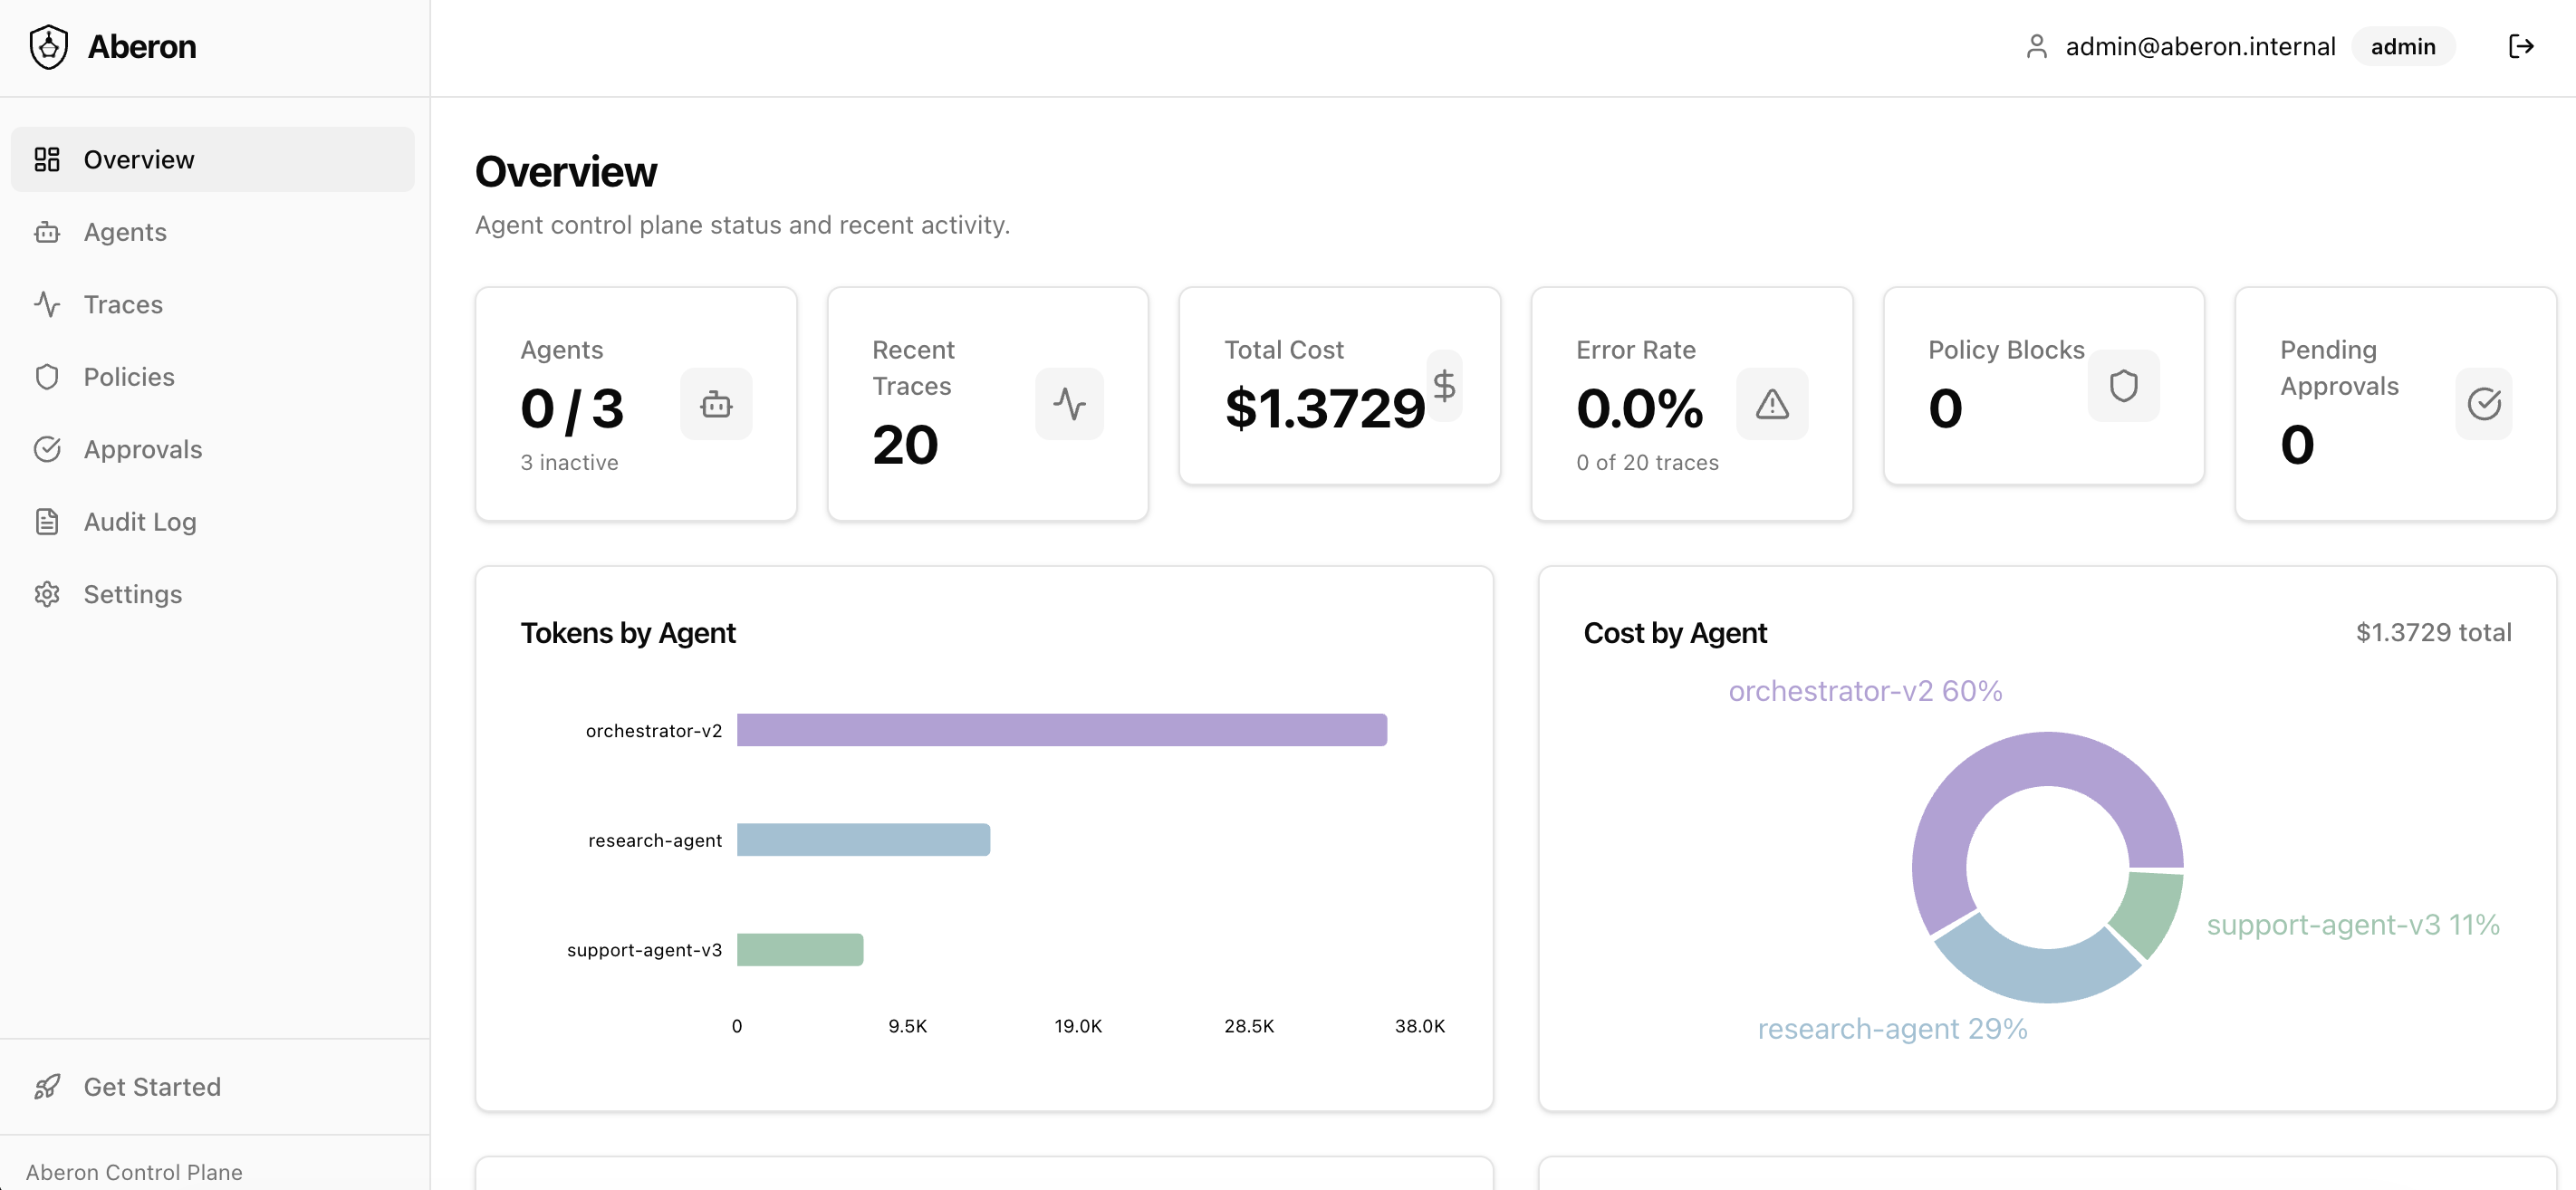
Dashboard
Everything in one place
Agent count, total cost, error rate, policy blocks, pending approvals — one glance tells you the full picture.
Deploy in 5 minutes — free forever.
No credit card, no trial period. All pillars above ship in the free tier.